

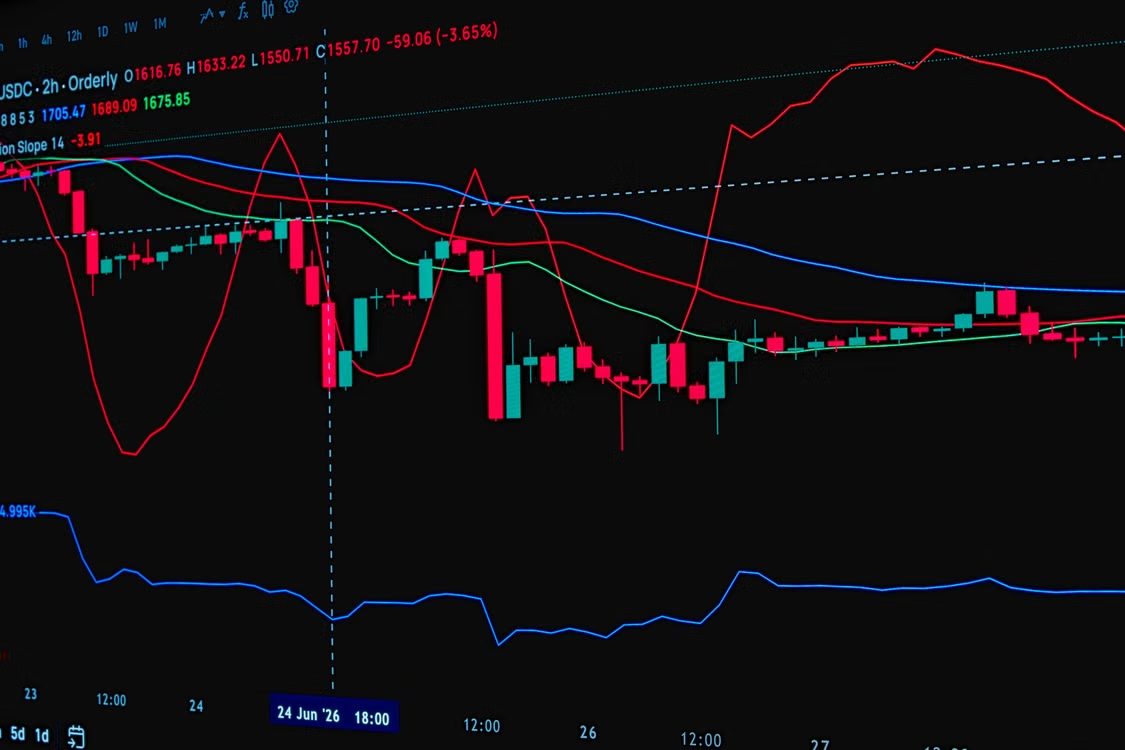
Crypto markets move really fast, so it can be hard for beginners to know when to enter or exit a trade. Technical indicators help by turning price and volume data into simple, more visual signals.
For the uninitiated, the point is never about collecting every indicator available on the internet. Look at what deserves your attention first, then focus on the tools that give you more impact without making the chart harder to read.
Fair to say, these tools aren’t a crystal ball. They don’t predict what’s next. Instead, they help traders track momentum trends, volatility, and the tug of war between buy and sell pressure. To get the best results, combine indicators with price action, support & resistance levels, market news, and good risk management. Good risk management is always required, never finished, because market conditions and trade sizes keep changing.
So, here are 5 technical indicators that every beginner crypto trader should understand, at least on a basic level.
Key Takeaways
- Technical indicators help crypto traders analyze various factors like price, volume, momentum, trends, and volatility using market data.
- RSI, moving averages, MACD, Bollinger Bands, and OBV each provide different insights into crypto market conditions.
- No single indicator can predict crypto prices. Traders should combine indicators with price action, support and resistance, market news, and risk management.
- Beginners should keep their charts simple, starting with two or three indicators serving different purposes rather than relying on too many signals.
What are Technical Indicators and Their Types?
Technical indicators are mathematical formulas that use market data such as price, volume, and time to create technical analysis. Traders plot them on trading charts and use them to identify potential trends, reversals, and changes in market momentum.
For example, one indicator might show whether an asset is overbought, while another one could help determine whether the market is trending or just moving sideways. This guide to technical indicators for crypto trading helps beginners exploring charts on Delta Exchange India, a bitcoin trading platform.
Relative strength index
The Relative Strength Index, or RSI, is a momentum indicator that tracks how quickly and how strongly recent prices have been moving. It ranges from 0-100, and it often uses a 14-period setting.
Traders usually follow these ways to read the RSI:
- When it’s above 70, it may point to overbought situations.
- When it’s below 30, it may point to oversold situations.
- Around 50, it may hint at more balanced momentum.
Now, an overbought reading usually means the price climbed pretty fast, and it might run into a pullback. For oversold, it’s more like the price dropped sharply and could recover. Still, these marks don’t promise a reversal. Bitcoin can stay overbought even while a strong uptrend continues.
Beginners often also watch for divergence. Bullish divergence shows up when price forms a lower low, but RSI forms a higher low. Bearish divergence is the opposite. The price makes a higher high, but RSI makes a lower high. If you want, read this RSI trading guide, and you’ll get how the indicator works on crypto charts, step by step, more or less.
Moving averages
Moving averages smooth out price swings and help traders see where the market is generally headed. They cut through the short-term noise and make long-term trends easier to spot, you know.
There are two main types:
- Simple Moving Average, where each period is weighted equally.
- Exponential Moving Average gives more weight to recent prices.
For faster lookbacks, a 20 or 21-period average is often used. The 50-period average can be used for medium-range trends, and the 100-period and 200-period averages are common for longer-horizon analysis.
If price trades above a moving average, it can be indicative of strength. But when it stays below, the market may be weaker or less steady, depending on the context.
Traders also watch for crossovers. You know, like when the shorter MA slides above the longer one, that’s a bullish crossover. But a bearish crossover is exactly the opposite.
Moving averages can help with trend analysis, but they’re lagging indicators, so they confirm a move that already started. They react after the price movement has begun, not before. For more context, see the SMA vs. EMA guide.
Moving average convergence divergence
Moving Average Convergence Divergence, also called the MACD, is a trend-following momentum tool. It looks at the relationship of 2 exponential moving averages.
The standard MACD setup includes:
- A 12-period EMA,
- A 26-period EMA,
- and a 9-period signal line.
When the MACD line crosses above the signal line, bullish momentum might be picking up. But when it crosses below the signal line, bearish momentum may be forming.
Then there’s the histogram; it shows how far apart the MACD line and the signal line are. Bigger bars can suggest stronger momentum, but if the bars start shrinking, it can mean momentum is easing off.
MACD is generally more practical on 4-hour or daily charts. On shorter timeframes, you can see a bunch of false crossovers, especially if the market is drifting sideways. There’s also a MACD guide for crypto traders that goes deeper into what the indicator is doing and how the parts fit together.
Bollinger bands
Bollinger Bands are a volatility measure. They’ve three lines: the middle band, usually a 20-period moving average. Then you have the upper and lower bands.
The upper and lower bands move farther apart when volatility rises, but when volatility drops, they contract. A phase of tight, narrow bands is often called a squeeze; it can be followed by a bigger price swing afterward, though Bollinger Bands don’t really tell you if the breakout will run upward or downward, no matter what.
If price touches the upper band, it may hint at strong momentum, or you know that the move could be overextended. Touching the lower band might suggest weakness, or maybe a possible rebound. Still, these contact points shouldn’t be treated as signals to buy and sell.
Bollinger Bands can also be useful for options traders when they’re trying to judge volatility. This guide to technical indicators for crypto options trading covers how to combine Bollinger Bands with RSI, MACD, and options-market data.
On-balance volume
On-Balance Volume, or OBV, is a volume-based metric. It helps traders look at buying and selling pressure.
The calculation works in a pretty straightforward way:
- Add volume when the price closes higher.
- Volume is subtracted when the price closes lower.
- No change is made when the price is unchanged.
If price and OBV are both climbing, then buying pressure may be backing the move. If price and OBV are both dropping, then selling pressure might be picking up instead.
OBV can also show divergence, y’know. Like, if price hits a fresh high but OBV doesn’t, the rally might be running on weaker volume support. On the other hand, if price just stays flat while OBV keeps rising, that can suggest buying pressure is building in the background.
Keep in mind that volume data can vary from exchange to exchange, so traders should not treat OBV as a flawless proxy for the whole crypto universe.
How to Combine These Indicators
Each indicator has its own different job and purpose:
| Purpose | Indicator |
|---|---|
| Momentum | RSI |
| Trend direction | Moving averages |
| Trend momentum | MACD |
| Volatility | Bollinger Bands |
| Buying and selling pressure | OBV |
For example, a trader might use a 50-period EMA to gauge the overall drift, while RSI is used to look at momentum. Bollinger Bands can be watched to sense volatility, and OBV helps answer whether the volume is really backing up the move.
That setup gives each tool a job, but more impact comes from knowing when to ignore a signal than from adding another indicator.
These indicators can be used on crypto assets, gold futures, and also Real World Asset products. That said, every market has slightly different drivers. Gold futures tend to react to things like interest rates, inflation, currencies, and geopolitical events. This look at gold and Bitcoin derivatives can add extra context.
For RWA products, there are also settlement concerns, liquidity frictions, plus collateral risks. Those elements might not show up cleanly on a simple price chart. So this RWA yield infrastructure analysis talks through some of those market-structure problems.
Final Thoughts
RSI, moving averages, MACD, Bollinger Bands, and OBV are a helpful starting kit for beginners. They make it easier to frame trend direction, momentum, volatility, and market participation.
Keep the indicator count small, and test on historical charts first. Most importantly, follow a straightforward risk-management plan. Technical indicators can support a trading choice, but they still can’t eliminate the risks of crypto trading.
Hopefully this post of mine helps you make sense of the indicators you see online, instead of simply adding more tools to the chart.
FAQs
What are technical indicators in crypto trading?
Technical indicators are mathematical tools that use price, volume, and time data to help people read trends, momentum, volatility, and buying or selling pressure.
Which technical indicator is best for beginners?
Honestly, there is no one best answer. RSI is great for momentum-type insights, moving averages help with trend spotting, and Bollinger Bands can gauge volatility.
Can technical indicators predict crypto prices?
No, they do not really predict. They only look at past market data, and sometimes false signals happen. Traders usually mix them with price action, market news, and solid risk management.
How many indicators should a beginner use?
A beginner can start with two or three indicators, each covering a different purpose. For example: a moving average for trend direction, RSI for momentum, and OBV as a volume confirmation.